Galaxy Catalog Analysis Example: Projected galaxy clustering
In this example, we’ll show how to calculate \(w_{\rm p},\) the projected clustering signal of a mock catalog.
There is also an IPython Notebook in the following location that can be used as a companion to the material in this section of the tutorial:
halotools/docs/notebooks/galcat_analysis/basic_examples/galaxy_catalog_analysis_tutorial4.ipynb
By following this tutorial together with this notebook, you can play around with your own variations of the calculation as you learn the basic syntax.
Generate a mock galaxy catalog
Let’s start out by generating a mock galaxy catalog into an N-body simulation in the usual way. Here we’ll assume you have the z=0 rockstar halos for the bolshoi simulation, as this is the default halo catalog.
from halotools.empirical_models import PrebuiltHodModelFactory
model = PrebuiltHodModelFactory('tinker13', threshold = 10.25)
from halotools.sim_manager import CachedHaloCatalog
halocat = CachedHaloCatalog(simname='bolshoi', redshift=0, halo_finder='rockstar')
model.populate_mock(halocat)
Extract subsamples of galaxy positions
The projected galaxy clustering signal is calculated by
the wp function from
the x, y, z positions of the galaxies stored in the galaxy_table.
We can retrieve these arrays as follows:
x = model.mock.galaxy_table['x']
y = model.mock.galaxy_table['y']
z = model.mock.galaxy_table['z']
As described in Formatting your xyz coordinates for Mock Observables calculations,
functions in the mock_observables package
such as wp take array inputs in a
specific form: a (Npts, 3)-shape Numpy array. You can use the
return_xyz_formatted_array convenience
function for this purpose, which has a built-in mask feature
that we’ll also demonstrate to select positions of quiescent and
star-forming populations.
from halotools.mock_observables import return_xyz_formatted_array

all_positions = return_xyz_formatted_array(x, y, z)

red_mask = (model.mock.galaxy_table['sfr_designation'] == 'quiescent')
blue_mask = (model.mock.galaxy_table['sfr_designation'] == 'active')

red_positions = return_xyz_formatted_array(x, y, z, mask = red_mask)
blue_positions = return_xyz_formatted_array(x, y, z, mask = blue_mask)
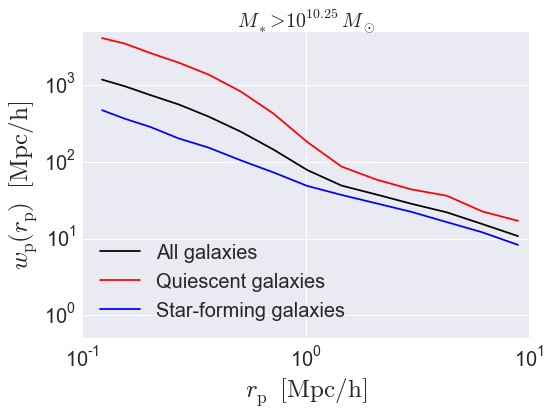
Calculate \(w_{\rm p}(r_{\rm p})\)
The correlation function \(w_{\rm p}(r_{\rm p})\) is related to the full redshift-space correlation function \(\xi(r_{\rm p}, \pi)\) via the following projection integral:
When calculating \(w_{\rm p}\), we therefore need to specify both the projected separation bins \(r_{\rm p}\) and the line-of-sight projection distance \(\pi_{\rm max}\).
from halotools.mock_observables import wp
import numpy as np

pi_max = 40.
rp_bins = np.logspace(-1,1.25,15)

wp_all = wp(all_positions, rp_bins, pi_max,
    period=model.mock.Lbox, num_threads='max')
wp_red = wp(red_positions, rp_bins, pi_max,
    period=model.mock.Lbox, num_threads='max')
wp_blue = wp(blue_positions, rp_bins, pi_max,
    period=model.mock.Lbox, num_threads='max')
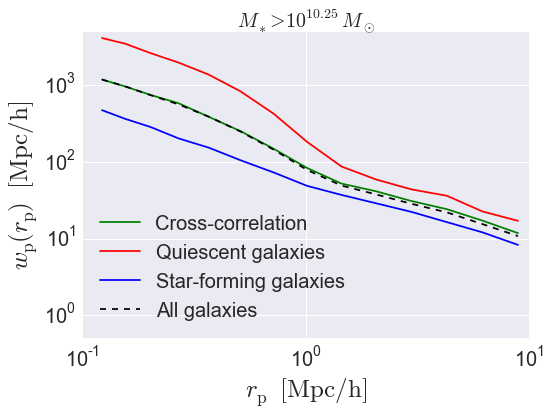
Calculating cross-correlations
The wp function also supports
calculating the cross-correlation
between two different samples. Here we’ll show how to calculate the
red-red, blue-blue, and red-blue clustering all in a single call to
wp.
wp_red_red, wp_red_blue, wp_blue_blue = wp(red_positions, rp_bins, pi_max,
                                           sample2 = blue_positions,
                                           period=model.mock.Lbox, num_threads='max',
                                           do_auto = True, do_cross = True)
This tutorial continues with Galaxy Catalog Analysis Example: Galaxy group identification.