Galaxy Catalog Analysis Example: Angular galaxy clustering
In this example, we’ll show how to calculate \(w(\theta),\) the angular clustering of a mock galaxy catalog. Since cosmological simulations occupy a periodic cube and the angular correlation is calculated in spherical coordinates, there are a few more steps that this calculation takes relative to the three-dimensional correlation function \(\xi(r)\).
Generate a mock galaxy catalog
Let’s start out by generating a mock galaxy catalog into an N-body simulation in the usual way. Here we’ll assume you have the z=0 rockstar halos for the bolshoi simulation, as this is the default halo catalog.
from halotools.empirical_models import PrebuiltSubhaloModelFactory
model = PrebuiltSubhaloModelFactory('behroozi10')

from halotools.sim_manager import CachedHaloCatalog
halocat = CachedHaloCatalog(simname = 'bolshoi', redshift=0)
model.populate_mock(halocat)
Extract subsamples of galaxy positions
In order to place our mock into angular coordinates, we’ll use the
mock_survey function. This function
expects a multi-dimensional array of spatial coordinates as input. The
code below shows how to transform our x, y, z coordinates into the
expected form.
mask = model.mock.galaxy_table['stellar_mass'] > 10**10.5
gals = model.mock.galaxy_table[mask]
coords = np.vstack([gals['x'], gals['y'], gals['z']]).T
vels = np.vstack([gals['vx'], gals['vy'], gals['vz']]).T
Transform to ra, dec, z coordinates
We now have our simulation box populated with mock galaxies. To
transform these points into angular coordinates, we’ll use the
mock_survey function. This function uses
the origin (0, 0, 0) as the point where an observer would look out and
observe the points filling the box.
from halotools.mock_observables import mock_survey
ra, dec, z = mock_survey.ra_dec_z(coords, vels, cosmo=model.mock.cosmology)
ra = np.degrees(ra)
dec = np.degrees(dec)
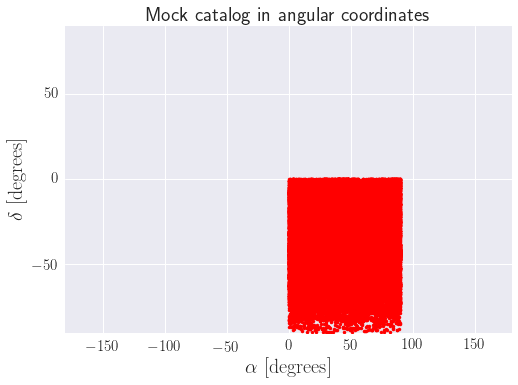
Since the three-dimensional region our mock occupies is the volume spanned by [0, Lbox], an observer standing at the origin would see that the mock universe subtends one octant of the sky. We can see that in the plot below.
from seaborn import plt

plt.plot(ra,dec,'.',color='red')
plt.xlim([-180,180])
plt.ylim([-90,90])
plt.ylabel(r'$\delta$  $[{\rm degrees}]$', fontsize=20)
plt.xlabel(r'$\alpha$  $[{\rm degrees}]$', fontsize=20)
plt.xticks(size=15)
plt.yticks(size=15)
plt.title('Mock catalog in angular coordinates', fontsize=20)
Generate randoms in ra, dec, z space
Since our mock catalog occupies a non-trivial geometry (a spherical octant), in order to calculate \(w(\theta)\) we need to generate a catalog of random points that occupies the same volume. To do this, we’ll just sprinkle random points in a [0, Lbox] cube and then transform those points into angular space in the same way we did with our mock.
Nran=10**5
ran_coords = np.random.random((Nran,3))*model.mock.Lbox
ran_vels = np.zeros((Nran,3))

ran_ra, ran_dec, ran_z = mock_survey.ra_dec_z(ran_coords, ran_vels, cosmo=model.mock.cosmology)
ran_ra = np.degrees(ran_ra)
ran_dec = np.degrees(ran_dec)
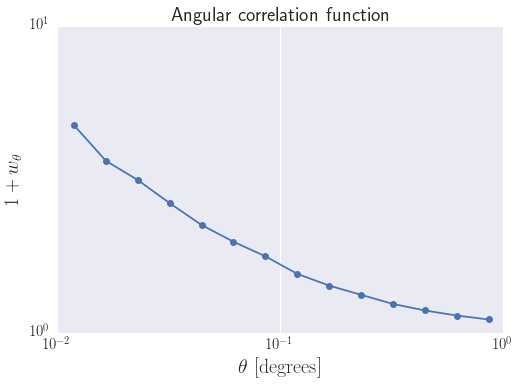
Calculate \(w(\theta)\)
Finally, we’ll use vstack once more to store our angular
coordinates into the multi-dimensional array shape expected by the
angular_tpcf function.
from halotools.mock_observables import angular_tpcf

angular_coords = np.vstack((ra,dec)).T
ran_angular_coords = np.vstack((ran_ra,ran_dec)).T

theta_bins = np.logspace(-2,0,15)
cen_theta_bins = (theta_bins[:-1]+theta_bins[1:])/2.0

w_theta_with_randoms = angular_tpcf(angular_coords, theta_bins, randoms=ran_angular_coords, num_threads='max')
plt.plot(cen_theta_bins,1.0+w_theta_with_randoms,'o-')
plt.loglog()
plt.ylabel(r'$1+w_{\theta}$', fontsize=20)
plt.xlabel(r'$\theta$  $[{\rm degrees}]$', fontsize=20)
_=plt.xticks(size=15)
_=plt.yticks(size=15)
_=plt.title('Angular correlation function', fontsize=20)
An alternative method without using randoms
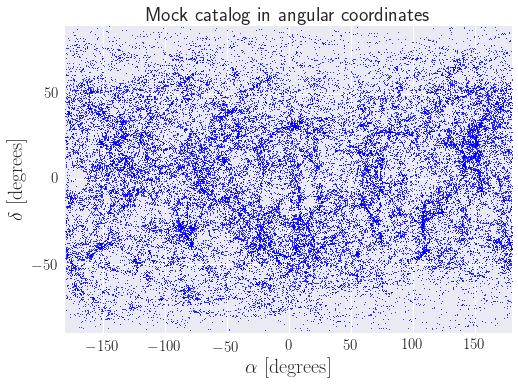
In the above calculation, the whole reason we needed to use randoms was because our mock occupied a non-trivial region in angular space. But if we instead shift our mock catalog so that the origin (0, 0, 0) is at the center of the universe, then after we transform to angular coordinates our mock will span the entire sphere and there will be no need for randoms.
coords = np.vstack((gals['x'],gals['y'],gals['z'])).T - model.mock.Lbox/2.0
vels = np.vstack((gals['vx'],gals['vy'],gals['vz'])).T

ra_init, dec_init, z = mock_survey.ra_dec_z(coords, vels, cosmo=model.mock.cosmology)

#keep a complete spherical volume
r = np.sqrt(coords[:,0]**2 + coords[:,1]**2 + coords[:,2]**2)
keep = r<model.mock.Lbox/2.0

ra = np.degrees(ra_init[keep])
dec = np.degrees(dec_init[keep])
Now observe that our mock data occupies the full sky
plt.plot(ra,dec,'.',color='blue', ms=2.0)
plt.xlim([-180,180])
plt.ylim([-90,90])
plt.ylabel(r'$\delta$  $[{\rm degrees}]$', fontsize=20)
plt.xlabel(r'$\alpha$  $[{\rm degrees}]$', fontsize=20)
plt.xticks(size=15)
plt.yticks(size=15)
plt.title('Mock catalog in angular coordinates', fontsize=20)
We can now calculate \(w(\theta)\) without using randoms
angular_coords = np.vstack((ra,dec)).T
w_theta = angular_tpcf(angular_coords, theta_bins, num_threads='max')
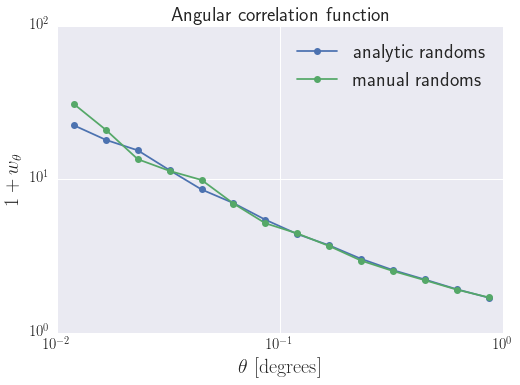
Let’s do the same using randoms as a comparison
Nran=10**5
ran_coords = np.random.random((Nran,3))*model.mock.Lbox - model.mock.Lbox/2.0
ran_vels = np.zeros((Nran,3))

ran_ra, ran_dec, ran_z = mock_survey.ra_dec_z(ran_coords, ran_vels, cosmo=model.mock.cosmology)

#keep a complete spherical volume
r = np.sqrt(ran_coords[:,0]**2 + ran_coords[:,1]**2 + ran_coords[:,2]**2)
keep = r<model.mock.Lbox/2.0

ran_ra = np.degrees(ran_ra[keep])
ran_dec = np.degrees(ran_dec[keep])
ran_angular_coords = np.vstack((ran_ra,ran_dec)).T

w_theta_with_randoms = angular_tpcf(angular_coords, theta_bins, randoms=ran_angular_coords,\
                                    num_threads='max')
plt.plot(cen_theta_bins,1.0+w_theta,'o-', label='analytic randoms')
plt.plot(cen_theta_bins,1.0+w_theta_with_randoms,'o-', label = 'manual randoms')
plt.loglog()
plt.ylabel(r'$1+w_{\theta}$', fontsize=20)
plt.xlabel(r'$\theta$  $[{\rm degrees}]$', fontsize=20)
plt.xticks(size=15)
plt.yticks(size=15)
plt.title('Angular correlation function', fontsize=20)
plt.legend(loc='best', fontsize=20)
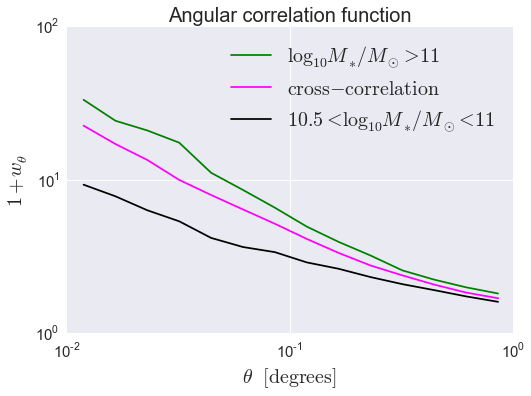
Calculating angular cross-correlations
The angular_tpcf can also be used to
calculate cross-correlations.
mask1 = (gals['stellar_mass'] > 10**10.5) & (gals['stellar_mass'] < 10**11)
mask2 = (gals['stellar_mass'] > 10**11)

sample1 = gals[mask1]
sample2 = gals[mask2]

coords1 = np.vstack((sample1['x'],sample1['y'],sample1['z'])).T - model.mock.Lbox/2.0
coords2 = np.vstack((sample2['x'],sample2['y'],sample2['z'])).T - model.mock.Lbox/2.0
vels1 = np.vstack((sample1['vx'],sample1['vy'],sample1['vz'])).T
vels2 = np.vstack((sample2['vx'],sample2['vy'],sample2['vz'])).T

ra_init1, dec_init1, z1 = mock_survey.ra_dec_z(coords1, vels1, cosmo=model.mock.cosmology)
ra_init2, dec_init2, z2 = mock_survey.ra_dec_z(coords2, vels2, cosmo=model.mock.cosmology)

# Throw out points that may have scattered beyond the box
keep1 = z1<model.mock.Lbox/2.0
keep2 = z2<model.mock.Lbox/2.0
ra1 = np.degrees(ra_init1[keep1])
ra2 = np.degrees(ra_init2[keep2])
dec1 = np.degrees(dec_init1[keep1])
dec2 = np.degrees(dec_init2[keep2])

angular_coords1 = np.vstack((ra1,dec1)).T
angular_coords2 = np.vstack((ra2,dec2)).T

w_theta11, w_theta12, w_theta22 = angular_tpcf(angular_coords1, theta_bins, sample2=angular_coords2,
                        num_threads='max', do_auto=True, do_cross=True)
Now plot the results
plt.plot(cen_theta_bins,1.0+w_theta22,'-', color='green',
         label = r'$\log_{10}M_{\ast}/M_{\odot} > 11$')
plt.plot(cen_theta_bins,1.0+w_theta12,'-', color='magenta',
         label = r'${\rm cross-correlation}$')
plt.plot(cen_theta_bins,1.0+w_theta11,'-', color='k',
         label = r'$10.5 < \log_{10}M_{\ast}/M_{\odot} < 11$')
plt.loglog()
plt.ylabel(r'$1+w_{\theta}$', fontsize=20)
plt.xlabel(r'$\theta$  $[{\rm degrees}]$', fontsize=20)
plt.xticks(size=15)
plt.yticks(size=15)
plt.title('Angular correlation function', fontsize=20)
plt.legend(loc='best', fontsize=20)