monte_carlo_from_cdf_lookup
- halotools.utils.monte_carlo_from_cdf_lookup(x_table, y_table, mc_input='random', num_draws=None, seed=None)[source]
Randomly draw a set of
num_drawspoints from any arbitrary input distribution function. The input distribution is specified in terms of its CDF, which is defined by the values of the inputy_tableof the CDF evaluated at an input set of control pointsx_table. The inputx_tableandy_tablecan be calculated from any input dataset using the functionbuild_cdf_lookup.- Parameters:
- x_tablendarray
Numpy array of shape (npts, ) providing the control points at which the input CDF has been tabulated.
- y_tablendarray
Numpy array of shape (npts, ) providing the values of the random variable associated with each input control point.
- mc_inputndarray, optional
Input array of shape (num_desired_draws, ) storing values between 0 and 1 specifying the values of the CDF for which associated values of
yare desired. Ifmc_inputis left unspecified, thenum_drawsmust be specified; in this case, the CDF will be randomly sampled.- num_drawsint, optional
Desired number of random draws from the input CDF.
num_drawsmust be specified ifmc_inputis left unspecified.- seedint, optional
Random number seed used in the Monte Carlo realization.
- Returns:
- mc_realizationndarray
Length-num_draws array of random draws from the input CDF.
Notes
See the Transformation of Probability tutorial for pedagogical derivations associated with inverse transformation sampling.
Examples
In this first example, we’ll start by creating some fake data,
y, drawn from a weighted combination of a Gaussian and a power law. We’ll think of the fake datayas if it came from some external dataset that we want to model, treating the fake data as our input distribution. We will use thebuild_cdf_lookupfunction to build the necessary lookup tablesx_tableandy_table, and then use themonte_carlo_from_cdf_lookupfunction to generate a Monte Carlo realization of the datay.>>> npts = int(1e4) >>> y = 0.1*np.random.normal(size=npts) + 0.9*np.random.power(2, size=npts) >>> x_table, y_table = build_cdf_lookup(y) >>> result = monte_carlo_from_cdf_lookup(x_table, y_table, num_draws=5000)
The returned array
resultis a stochastic Monte Carlo realization of the distribution specified byy.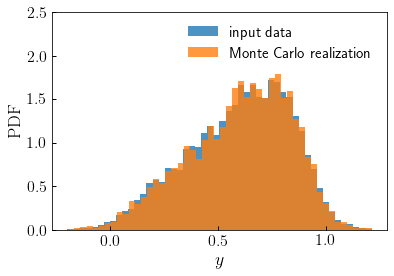
Now let’s consider a second example where, rather than specifying an integer number of purely random Monte Carlo draws, instead we pass in an array of uniform random numbers.
>>> uniform_randoms = np.random.rand(npts)
>>> result2 = monte_carlo_from_cdf_lookup(x_table, y_table, mc_input=uniform_randoms)
This alternative call to
monte_carlo_from_cdf_lookupprovides completely equivalent results as the first, because we have passed in uniform randoms. Sinceuniform_randomsjust stores random values, then random values from the input distribution will be returned.However, this alternative form of input can be exploited for other applications. Suppose that instead of purely random draws, you wish to draw from the input distribution
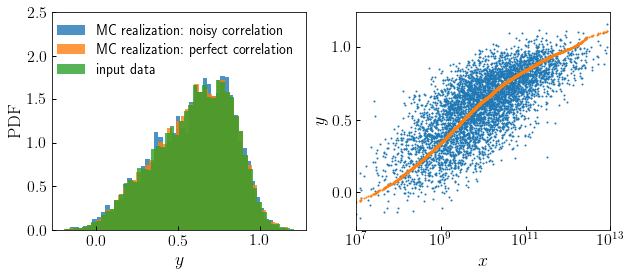
yin such a way that you introduce a correlation between the drawn values and the values stored in some other array,x. You can accomplish this by passing in the rank-order percentile values ofxinstead of uniform randoms. This is the basis of the conditional abundance matching technique implemented by theconditional_abunmatch_bin_basedfunction.To see an example of how this works, let’s create some fake data for some property x that we wish to model as being correlated with Monte Carlo realizations of y while preserving the PDF of the realization:
>>> x = np.sort(10**np.random.normal(loc=10, size=5000))
>>> x_percentile = (1. + np.arange(len(x)))/float(len(x)+1)
>>> correlated_result = monte_carlo_from_cdf_lookup(x_table, y_table, mc_input=x_percentile)
>>> uniform_randoms = np.random.rand(npts)
>>> uncorrelated_result = monte_carlo_from_cdf_lookup(x_table, y_table, mc_input=uniform_randoms)
We can use the
noisy_percentileto introduce variable levels of noise in the correlation.>>> from halotools.empirical_models import noisy_percentile >>> noisy_x_percentile = noisy_percentile(x_percentile, correlation_coeff=0.75) >>> weakly_correlated_result = monte_carlo_from_cdf_lookup(x_table, y_table, mc_input=noisy_x_percentile)