Modeling Satellite Galaxy Quenching Gradients
Observations indicate that satellite galaxies are redder in the inner regions of their host dark matter halos. One way to model this phenomenon is to use CAM to correlate the quenching probability with host-centric position. For example, Zu and Mandelbaum 2016 model satellite quenching with a simple analytical function \({\rm Prob(\ quenched}\ \vert\ M_{\rm host})\), where \(M_{\rm host}\) is the dark matter mass of the satellite’s parent halo. For a standard implementation of this model, you can draw from a random uniform number generator of the unit interval, and evaluate whether those draws are above or below \({\rm Prob(\ quenched)}\).
Alternatively, to implement CAM you would compute
\(p={\rm Prob(< r/R_{vir}}\ \vert\ M_{\rm host})\) for each simulated subhalo,
and then evaluate whether each \(p\)
is above or below \({\rm Prob(\ quenched}\ \vert\ M_{\rm host})\).
This technique lets you generate a series of mocks with exactly the same
\({\rm Prob(\ quenched}\ \vert\ M_{\rm host})\),
but with tunable levels of quenching gradient, ranging from zero gradient
to the statistical extrema.
The sliding_conditional_percentile function can be used to
calculate \(p={\rm Prob(< r/R_{vir}}\ \vert\ M_{\rm host}).\)
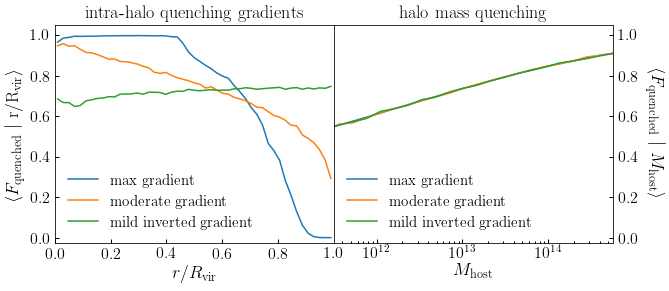
The plot below demonstrates three different mock catalogs made with CAM in this way. The left hand plot shows how the quenched fraction of satellites varies with intra-halo position. The right hand plot confirms that all three mocks have statistically indistinguishable “halo mass quenching”, even though their gradients are very different.
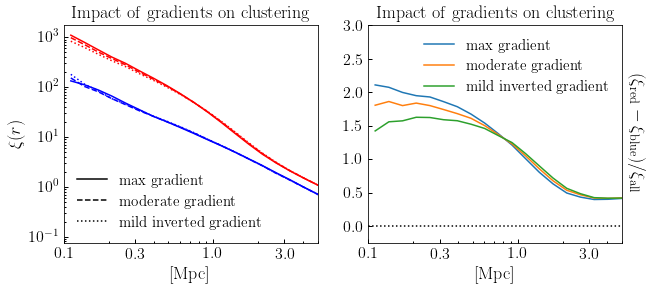
The next plot compares the 3d clustering between these models.
For implementation details, the code producing these plots can be found in the following Jupyter notebook:
halotools/docs/notebooks/galcat_analysis/intermediate_examples/quenching_gradient_tutorial.ipynb